|
本文介绍安装及使用Termgraph的方法,我们将使用Termgraph在终端上绘制基本图形,Termgraph可用于在终端上绘制多个图形,如条形图、彩色图表、多变量、堆积图表、水平或垂直和表情符号。
下载链接
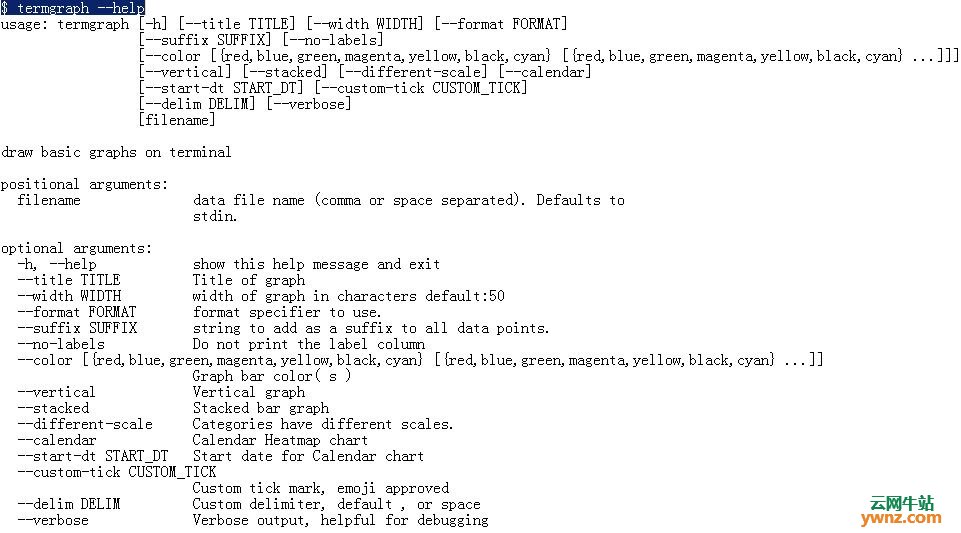
在Linux上安装Termgraph 以下是安装和使用Termgraph在终端上绘制基本图形的步骤。 第1步:安装Python3 Termgraph要求在本地系统上安装python3,对于Arch Linux用户,python3是OS附带的默认版本。 如果运行CentOS 7/6或任何其他RHEL衍生产品,则可在EPEL存储库上使用python3,添加epel repo然后使用命令安装python3: $ sudo yum install -y epel-release $ sudo yum install python36-setuptools git -y 在Ubuntu LTS版本中,Python3可以在jonathonf PPA上使用,使用以下命令添加它: $ sudo add-apt-repository ppa:jonathonf/python-3.6 然后检查更新并安装python3(即使它们通常随python 3一起提供,如果已安装,则可以跳过此步骤): $ sudo apt-get update -y && apt-get install git python3.6 参考:在Ubuntu 18.04系统中安装Python 3.7.0的方法。 第2步:安装colorama Python模块 要安装colorama,你需要安装pip3,如果尚未安装,请运行以下命令进行安装。 关于RHEL衍生系统: $ sudo easy_install-3.6 pip 关于Debian衍生系统: $ sudo apt-get install -y python3-pip 安装pip3后,使用以下命令安装colorama: $ sudo pip3 install colorama 第3步:在Linux上安装Termgraph 要安装termgraph,clone termgraph存储库: $ git clone https://github.com/mkaz/termgraph.git Cloning into 'termgraph'... remote: Counting objects: 183, done. remote: Compressing objects: 100% (57/57), done. remote: Total 183 (delta 46), reused 74 (delta 31), pack-reused 88 Receiving objects: 100% (183/183), 320.91 KiB | 37.00 KiB/s, done. Resolving deltas: 100% (79/79), done. 你现在可以使用termgraph绘制图形了: $ cd termgraph $ ls data docs readme.md termgraph.py 将termgraph.py复制到/usr/local/bin: $ sudo cp termgraph.py /usr/local/bin/termgraph $ ls /usr/local/bin/termgraph 由于/usr/local/bin/位于$PATH中,你可以通过调用名称来检查Termgraph来开始使用。 查看有关termgraph基本用法的帮助页面,运行termgraph --help命令:
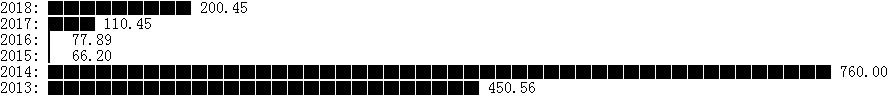
Termgraph的使用方法 1、创建一个包含两列逗号或空格的数据文件,第一列是你的标签,第二列是数字数据: $ mkdir termgraph-data $ cd termgraph-data 创建测试数据文件: $ cat dset1.dat 2018 200.45 2017 110.45 2016 77.89 2015 66.2 2014 760.00 2013 450.56 然后在终端上生成图表:
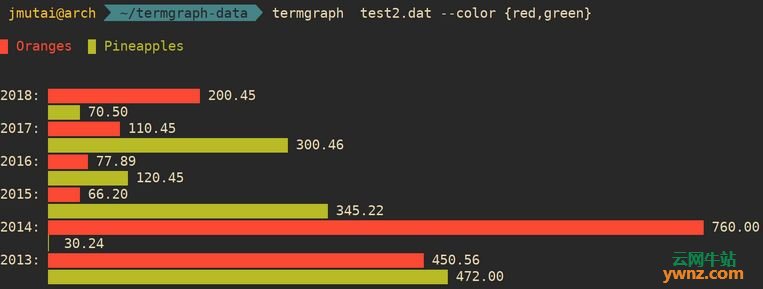
这将从filedset1.dat读取数据。 你也可以使用颜色,见下面: $ cat test2.dat # Example Data Set with 2 Categories @ Oranges,Pineapples 2018,200.45,70.5 2017,110.45,300.46 2016,77.89,120.45 2015,66.2,345.22 2014,760.00,30.24 2013,450.56,472 然后: $ termgraph test2.dat --color {red,green}
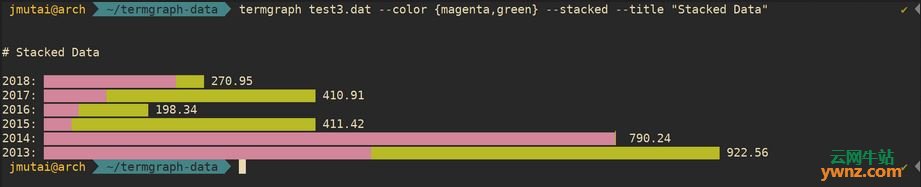
2、处理没有类别的堆叠数据: $ cat test3.dat # Example Data Set without Categories' names 2018,200.45,70.5 2017,110.45,300.46 2016,77.89,120.45 2015,66.2,345.22 2014,760.00,30.24 2013,450.56,472 然后运行: $ termgraph test3.dat --color {magenta,green} --stacked --title "Stacked Data"
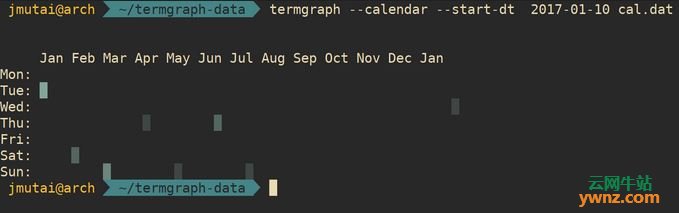
3、使用日历热图 这要求第一列是YYYY-mm-dd格式的日期: $ cat cal.dat 2017-01-10 100.34 2017-02-11 50.00 2017-03-12 66.45 2017-04-13 10.11 2017-05-14 0.00 2017-06-15 30 2017-07-16 24.56 2018-01-10 6.55 2018-02-11 6.88 2018-03-12 10.34 2018-04-13 40.45 2018-05-14 66.78 2018-06-15 55.45 2018-07-16 5.67 你可以指定开始日期:
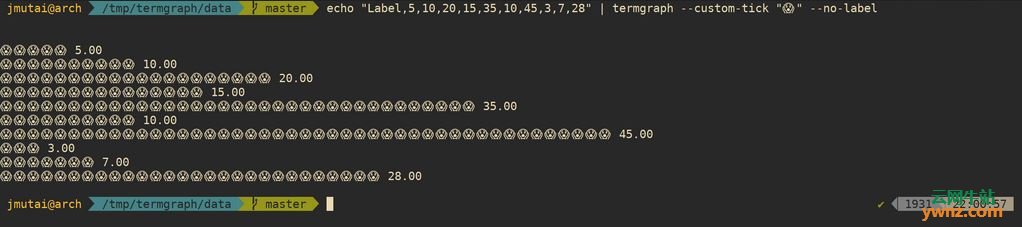
4、使用stdin和表情符号 在stdin上提供表情符号的示例: echo "Label,5,10,20,15,35,10,45,3,7,28" | termgraph --custom-tick "?" --no-label 输出内容如下所示:
至此,大致的Termgraph使用方法讲到这里了。
相关主题 |