|
本文介绍使用Prometheus和Grafana监控Redis服务器的方法。安装参考文章:在RHEL 8系统上安装Prometheus 2.6.0的步骤、在RHEL 8系统上安装Grafana 5.4.2的步骤。
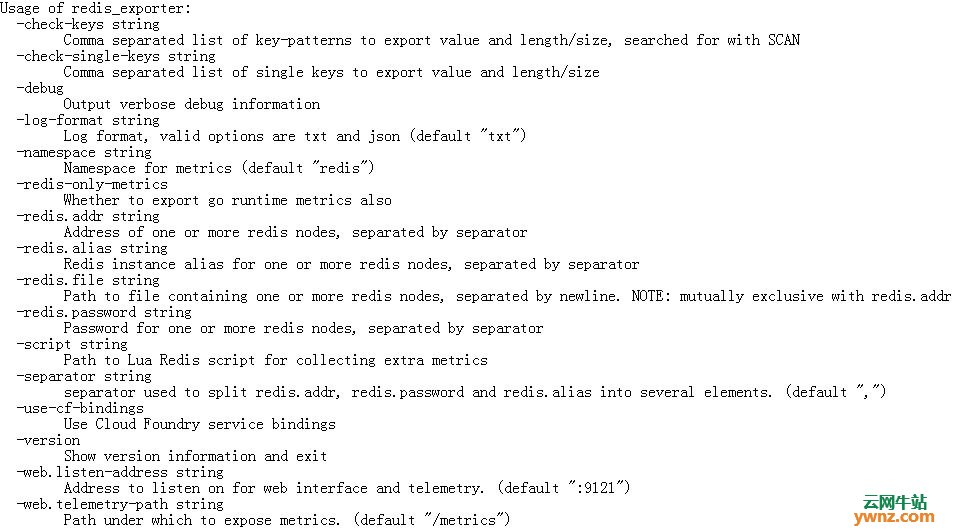
一、下载并安装Redis Prometheus导出器 此Redis指标的Prometheus导出器支持Redis 2.x,3.x和4.x: wget https://github.com/oliver006/redis_exporter/releases/download/v0.28.0/redis_exporter-v0.28.0.linux-amd64.tar.gz 提取下载的存档文件: tar xvf redis_exporter-v0.28.0.linux-amd64.tar.gz sudo mv redis_exporter /usr/local/bin/ rm -f redis_exporter-v0.28.0.linux-amd64.tar.gz redis_exporter应该可以从你当前的SHELL执行: $ redis_exporter -version 返回的信息如果是v0.28.0即为成功。 要获取支持的所有选项的列表,请执行--help选项: # redis_exporter --help
二、创建Prometheus redis导出程序systemd service/Init脚本 用户prometheus将用于运行服务,添加Promethes系统用户(如果不存在): sudo groupadd --system prometheus sudo useradd -s /sbin/nologin --system -g prometheus prometheus 然后继续创建systemd服务单元文件: sudo vim /etc/systemd/system/redis_exporter.service 添加以下内容: [Unit] Description=Prometheus Documentation=https://github.com/oliver006/redis_exporter Wants=network-online.target After=network-online.target [Service] Type=simple User=prometheus Group=prometheus ExecReload=/bin/kill -HUP $MAINPID ExecStart=/usr/local/bin/redis_exporter --log-format=txt --namespace=redis --web.listen-address=:9121 --web.telemetry-path=/metrics SyslogIdentifier=redis_exporter Restart=always [Install] WantedBy=multi-user.target 对于Init系统,安装daemonize(CentOS/Ubuntu): sudo yum -y install daemonize sudo apt-get install daemonize 创建init脚本: sudo vim /etc/init.d/redis_exporter 增加: #!/bin/bash # Author: Josphat Mutai, kiplangatmtai@gmail.com , https://github.com/jmutai # redis_exporter This shell script takes care of starting and stopping Prometheus redis exporter # # chkconfig: 2345 80 80 # description: Prometheus redis exporter start script # processname: redis_exporter # pidfile: /var/run/redis_exporter.pid # Source function library. . /etc/rc.d/init.d/functions RETVAL=0 PROGNAME=redis_exporter PROG=/usr/local/bin/${PROGNAME} RUNAS=prometheus LOCKFILE=/var/lock/subsys/${PROGNAME} PIDFILE=/var/run/${PROGNAME}.pid LOGFILE=/var/log/${PROGNAME}.log DAEMON_SYSCONFIG=/etc/sysconfig/${PROGNAME} # GO CPU core Limit #GOMAXPROCS=$(grep -c ^processor /proc/cpuinfo) GOMAXPROCS=1 # Source config . ${DAEMON_SYSCONFIG} start() { if [[ -f $PIDFILE ]] > /dev/null; then echo "redis_exporter is already running" exit 0 fi echo -n "Starting redis_exporter service…" daemonize -u ${USER} -p ${PIDFILE} -l ${LOCKFILE} -a -e ${LOGFILE} -o ${LOGFILE} ${PROG} ${ARGS} RETVAL=$? echo "" return $RETVAL } stop() { if [ ! -f "$PIDFILE" ] || ! kill -0 $(cat "$PIDFILE"); then echo "Service not running" return 1 fi echo 'Stopping service…' #kill -15 $(cat "$PIDFILE") && rm -f "$PIDFILE" killproc -p ${PIDFILE} -d 10 ${PROG} RETVAL=$? echo [ $RETVAL = 0 ] && rm -f ${LOCKFILE} ${PIDFILE} return $RETVAL } status() { if [ -f "$PIDFILE" ] || kill -0 $(cat "$PIDFILE"); then echo "redis exporter service running..." echo "Service PID: `cat $PIDFILE`" else echo "Service not running" fi RETVAL=$? return $RETVAL } # Call function case "$1" in start) start ;; stop) stop ;; restart) stop start ;; status) status ;; *) echo "Usage: $0 {start|stop|restart}" exit 2 esac 创建参数配置文件: sudo vim /etc/sysconfig/redis_exporter 定义使用的命令参数: ARGS="--log-format=txt --namespace=redis --web.listen-address=:9121 --web.telemetry-path=/metrics" 测试脚本: # /etc/init.d/redis_exporter Usage: /etc/init.d/redis_exporter {start|stop|restart}
三、启动Redis Prometheus导出器并启用服务以在启动时启动 对于Systemd服务器,请使用systemctl命令: sudo systemctl enable redis_exporter sudo systemctl start redis_exporter 对于SysV Init系统,请使用: sudo /etc/init.d/redis_exporter start sudo chkconfig redis_exporter on 你可以验证服务是否正在运行: $ sudo /etc/init.d/redis_exporter status redis exporter service running... Service PID: 27106 $ sudo chkconfig --list | grep redis_exporter redis_exporter 0:off 1:off 2:on 3:on 4:on 5:on 6:off $ sudo ss -tunelp | grep 9121 tcp LISTEN 0 128 :::9121 :::* users:(("redis_exporter",1970,6)) ino:1823474168 sk:ffff880341cd7800
四、将导出器作业添加到Prometheus 最后一步是向Prometheus服务器添加作业以抓取指标,编辑/etc/prometheus/prometheus.yml: # Redis Servers - job_name: 10.10.10.3-redis static_configs: - targets: ['10.10.10.3:9121'] labels: alias: 10.10.10.3 - job_name: 10.10.10.4-redis static_configs: - targets: ['10.10.10.4:9121'] labels: alias: 10.10.10.4 重新启动prometheus服务以开始抓取数据指标: sudo systemctl restart prometheus 从Prometheus服务器测试对端口9121的访问,它应该能够连接: $ telnet 10.1.10.15 9121 Trying 10.1.10.15... Connected to 10.1.10.15. Escape character is '^]'. ^] 如果无法连接,请检查你的服务端口和防火墙。
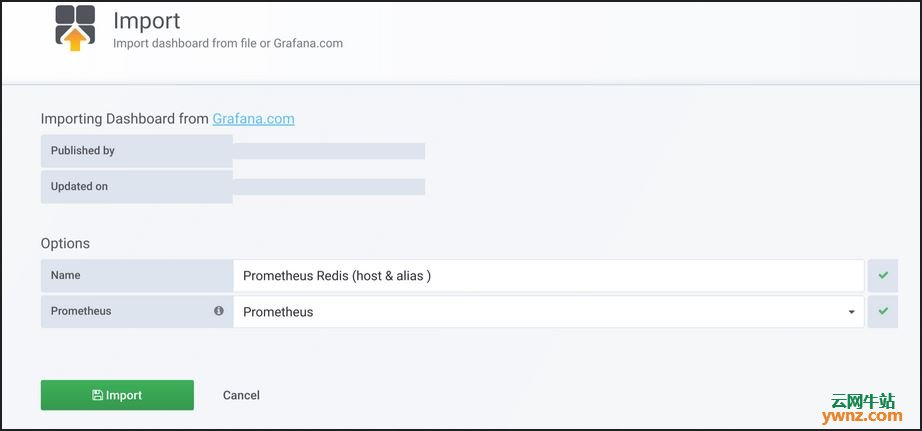
五、将仪表板添加到Grafana 将Prometheus数据源添加到Grafana并导入或创建Redis的grafana仪表板。 Grafana仪表板可在https://grafana.net/dashboards/763上获得,我的作业配置使用别名,我将在github上使用带有主机和别名选择器的Grafana仪表板。 下载仪表板json文件(Linux中的Json格式化神器jq下载与安装)。 在Grafana UI上,转到“创建”>“导入仪表板”>“上载.json文件”,选择下载的json文件,然后单击“导入”:
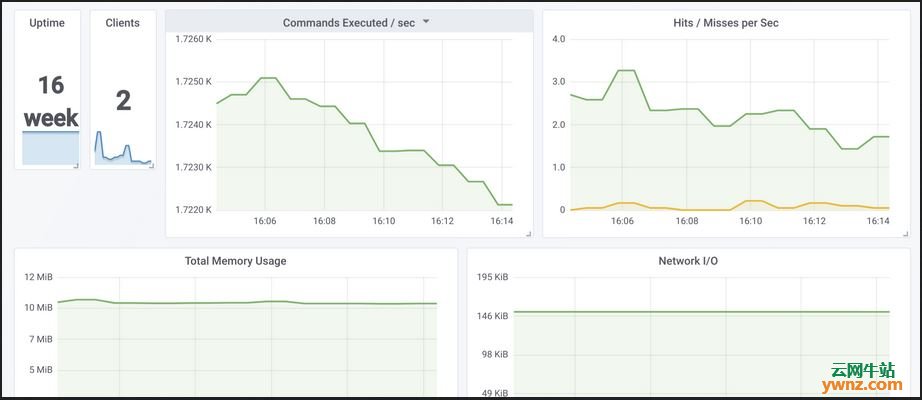
等待数据开始出现在你的Grafana仪表板上,下面是一个示例视图:
至此,你完全可以使用Grafana监控你的Redis服务器了。
相关主题 |