|
本文介绍使用Prometheus和Grafana监控Apache Web服务器的方法,此设置适用于在任何Linux版本上运行的任何版本的Apache Web服务器,按照下面设置的方法将Apache Web Server度量标准存储在Prometheus上,并使用Grafana进行可视化。安装请先参考在RHEL 8系统上安装Prometheus 2.6.0的步骤及在RHEL 8系统上安装Grafana 5.4.2的步骤。
一、下载并安装Apache Prometheus导出器 下载版本为0.5.0: wget https://github.com/Lusitaniae/apache_exporter/releases/download/v0.5.0/apache_exporter-0.5.0.linux-amd64.tar.gz 提取下载的存档: tar xvf apache_exporter-0.5.0.linux-amd64.tar.gz sudo cp apache_exporter-0.5.0.linux-amd64/apache_exporter /usr/local/bin apache_exporter可以从你当前的SHELL中执行: $ apache_exporter -version apache_exporter, version 0.5.0
二、创建Apache Prometheus导出程序systemd服务 首先,添加将运行该服务的prometheus用户: sudo groupadd --system prometheus sudo useradd -s /sbin/nologin --system -g prometheus prometheus 然后继续创建systemd服务单元文件: sudo vim /etc/systemd/system/apache_exporter.service 添加以下内容: [Unit] Description=Prometheus Documentation=https://github.com/Lusitaniae/apache_exporter Wants=network-online.target After=network-online.target [Service] Type=simple User=prometheus Group=prometheus ExecReload=/bin/kill -HUP $MAINPID ExecStart=/usr/local/bin/apache_exporter \ --insecure \ --scrape_uri=http://localhost/server-status/?auto \ --telemetry.address=0.0.0.0:9117 \ --telemetry.endpoint=/metrics SyslogIdentifier=apache_exporter Restart=always [Install] WantedBy=multi-user.target 该服务将侦听端口9117,并在/metrics URI上公开指标,如果Apache指标不在http://localhost/server-status/?auto上,则需要更改URL。 对于像CentOS 6.x这样的Init系统,在/etc/init.d/下创建一个init脚本: sudo vim /etc/init.d/apache_exporter 增加: #!/bin/bash # Author: Josphat Mutai, kiplangatmtai@gmail.com , https://github.com/jmutai # apache_exporter This shell script takes care of starting and stopping Prometheus apache exporter # # chkconfig: 2345 80 80 # description: Prometheus apache exporter start script # processname: apache_exporter # pidfile: /var/run/apache_exporter.pid # Source function library. . /etc/rc.d/init.d/functions RETVAL=0 PROGNAME=apache_exporter PROG=/usr/local/bin/${PROGNAME} RUNAS=prometheus LOCKFILE=/var/lock/subsys/${PROGNAME} PIDFILE=/var/run/${PROGNAME}.pid LOGFILE=/var/log/${PROGNAME}.log DAEMON_SYSCONFIG=/etc/sysconfig/${PROGNAME} # GO CPU core Limit #GOMAXPROCS=$(grep -c ^processor /proc/cpuinfo) GOMAXPROCS=1 # Source config . ${DAEMON_SYSCONFIG} start() { if [[ -f $PIDFILE ]] > /dev/null; then echo "apache_exporter is already running" exit 0 fi echo -n "Starting apache_exporter service…" daemonize -u ${USER} -p ${PIDFILE} -l ${LOCKFILE} -a -e ${LOGFILE} -o ${LOGFILE} ${PROG} ${ARGS} RETVAL=$? echo "" return $RETVAL } stop() { if [ ! -f "$PIDFILE" ] || ! kill -0 $(cat "$PIDFILE"); then echo "Service not running" return 1 fi echo 'Stopping service…' #kill -15 $(cat "$PIDFILE") && rm -f "$PIDFILE" killproc -p ${PIDFILE} -d 10 ${PROG} RETVAL=$? echo [ $RETVAL = 0 ] && rm -f ${LOCKFILE} ${PIDFILE} return $RETVAL } status() { if [ -f "$PIDFILE" ] || kill -0 $(cat "$PIDFILE"); then echo "apache exporter service running..." echo "Service PID: `cat $PIDFILE`" else echo "Service not running" fi RETVAL=$? return $RETVAL } # Call function case "$1" in start) start ;; stop) stop ;; restart) stop start ;; status) status ;; *) echo "Usage: $0 {start|stop|restart}" exit 2 esac 安装daemonize包: sudo yum -y install daemonize 创建参数配置文件: sudo vim /etc/sysconfig/apache_exporter 增加: ARGS="--insecure --scrape_uri=http://localhost/server-status/?auto --telemetry.address=0.0.0.0:9117 --telemetry.endpoint=/metrics" 测试脚本: # /etc/init.d/apache_exporter Usage: /etc/init.d/apache_exporter {start|stop|restart}
三、启动Apache Prometheus导出器并启用服务以在启动时启动 sudo /etc/init.d/apache_exporter start sudo chkconfig apache_exporter on 你可以验证使用: $ sudo /etc/init.d/apache_exporter status apache exporter service running... Service PID: 1970 $ sudo chkconfig --list | grep apache_exporter apache_exporter 0:off 1:off 2:on 3:on 4:on 5:on 6:off $ sudo ss -tunelp | grep 9117 tcp LISTEN 0 128 :::9117 :::* users:(("apache_exporter",1970,6)) ino:1823474168 sk:ffff880341cd7800
四、将导出器作业添加到Prometheus 将作业添加到Prometheus服务器以获取指标,编辑/etc/prometheus/prometheus.yml: # Apache Servers - job_name: apache1 static_configs: - targets: ['10.1.10.15:9117'] labels: alias: server1-apache - job_name: apache2 static_configs: - targets: ['10.1.10.16:9117'] labels: alias: server2-apache 重启prometheus服务以开始抓取: sudo systemctl restart prometheus 从Prometheus服务器测试对端口9117的访问: $ telnet 10.1.10.15 9117 Trying 10.1.10.15... Connected to 10.1.10.15. Escape character is '^]'. ^]
五、将仪表板添加到Grafana 最后一步是创建自己的仪表板,以便可视化Apache指标,对于本演示,我们将使用仪表板ID为3894,参考使用Prometheus和Grafana监控Linux服务器性能的方法,你应该已将Prometheus数据源添加到Grafana,或使用添加Prometheus数据源链接添加一个。 添加数据源后,导航到仪表板>导入,导入Apache Grafana仪表板,使用3894表示Grafana仪表板ID:
为其指定一个描述性名称,然后选择之前添加的Prometheus数据源:
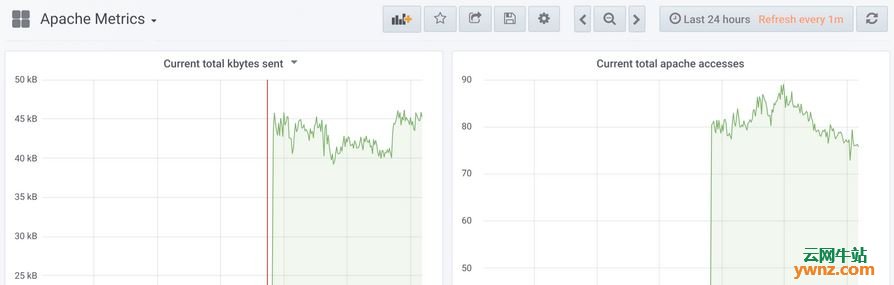
单击导入按钮开始使用仪表板,几分钟后,指标应该开始显示了:
同时可以选择其他主机以显示使用指标仪表板顶部的下拉菜单的指标。
相关主题 |