|
本文介绍使用Grafana、Influxdb和Telegraf监视Zimbra服务器的方法,这种监控是在一个Zimbra服务器部署中完成的,请先安装Zimbra Server,参考在Ubuntu 18.04系统上安装Zimbra Collaboration的方法。
一、安装和配置InfluxDB 1、安装InfluxDB 请参考: 在Ubuntu 18.04/Debian 9系统上安装InfluxDB的方法。 在RHEL 8/CentOS 8上安装InfluxDB的方法。 2、配置Influxdb 打开Influxdb配置文件: sudo vim /etc/influxdb/influxdb.conf 设置如下: # Uncomment line 15 bind-address = "127.0.0.1:8088" # On line 247 under http, uncomment it if you need http authentication [http] # Determines whether HTTP endpoint is enabled. enabled = true # On line 256, make sure that: bind-address = ":8086" 在防火墙上启用端口。 针对CentOS 7系统: sudo firewall-cmd --add-port=8086/tcp --permanent sudo firewall-cmd --reload 针对Ubuntu系统: sudo ufw allow 8086/tcp
二、安装和配置Telegraf 1、安装Telegraf 由于已经添加了存储库,只需安装telegraf即可: 针对CentOS系统: sudo yum -y install telegraf 针对Ubuntu系统: sudo apt-get -y install telegraf 参考: 在Ubuntu 18.04/Debian 9上安装Telegraf的方法。 在RHEL 8/CentOS 8上安装Telegraf的方法。 2、配置Telegraf 使用文本编辑器修改Telegraf配置文件: sudo vim /etc/telegraf/telegraf.conf 设置如下: [global_tags] # Configuration for telegraf agent [agent] interval = "10s" debug = false hostname = "server-hostname" round_interval = true flush_interval = "10s" flush_jitter = "0s" collection_jitter = "0s" metric_batch_size = 1000 metric_buffer_limit = 10000 quiet = false logfile = "" omit_hostname = false #################################### OUTPUTS #################################### [[outputs.influxdb]] urls = ["http://influxdb-ip:8086"] # Input valid InfluxDB URL, IP address, and port database = "database-name" # Input InfluxDB database name for this host timeout = "0s" username = "auth-username" # Input InfluxDB http authentication username. password = "auth-password" # Input InfluxDB http authentication password. retention_policy = "" #################################### INPUTS #################################### [[inputs.cpu]] percpu = true totalcpu = true collect_cpu_time = false report_active = false [[inputs.disk]] ignore_fs = ["tmpfs", "devtmpfs", "devfs"] [[inputs.io]] [[inputs.mem]] [[inputs.net]] [[inputs.system]] [[inputs.swap]] [[inputs.netstat]] [[inputs.processes]] [[inputs.kernel]] ## Add the following for Zimbra Specific statistics.. [[inputs.procstat]] exe = "memcached" prefix = "memcached" [[inputs.procstat]] exe = "java" prefix = "java" [[inputs.procstat]] exe = "mysqld" prefix = "mysqld" [[inputs.procstat]] exe = "slapd" prefix = "slapd" [[inputs.procstat]] exe = "nginx" prefix = "nginx" [[inputs.exec]] commands = ["/opt/zimbra/common/bin/zimbra_pflogsumm.pl -d today /var/log/zimbra.log"] name_override = "zimbra_stats" data_format = "influx" [[inputs.exec]] commands = ["sed 's/……………………//' /opt/zimbra/jetty/webapps/zimbra/downloads/.git/HEAD"] name_override = "zimbra_stats" data_format = "value" data_type = "string" 下载Perl脚本以从Zimbra Collaboration收集信息: curl -sL https://raw.githubusercontent.com/jorgedlcruz/zimbra-grafana/master/zimbra_pflogsumm.pl | sudo tee /opt/zimbra/common/bin/zimbra_pflogsumm.pl chmod +rwxr+xr+x /opt/zimbra/common/bin/zimbra_pflogsumm.pl 证明它向你返回内容,并且telegra用户可以通过启动来运行它: sudo -u telegraf /opt/zimbra/common/bin/zimbra_pflogsumm.pl /var/log/zimbra.log 完成后,重新启动telegraf服务: sudo systemctl restart telegraf
三、安装和配置Grafana 1、安装Grafana 在服务器上安装Grafana,参考: 在Ubuntu 18.04系统中安装Grafana 6的方法。 2、配置Grafana 默认HTTP端口为3000,默认用户和组为admin。 将端口添加到防火墙。 针对CentOS 7系统: sudo firewall-cmd --add-port=3000/tcp --permanent sudo firewall-cmd --reload 针对Ubuntu系统: sudo ufw allow 3000/tcp 完成后,请在浏览器中输入http://ip-address:3000地址,用户名和密码都是admin 建议初次登录后重置密码。
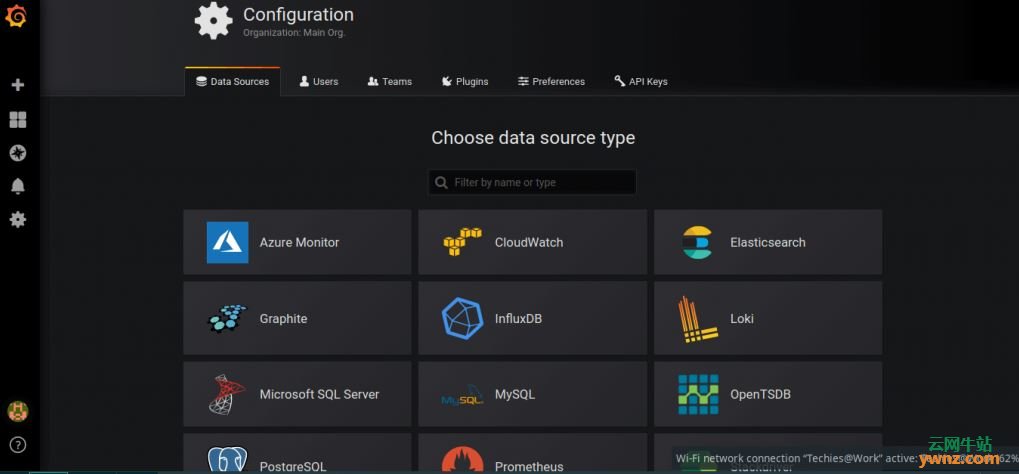
四、导入数据源的配置 登录Grafana并添加InfluxDB数据源:
点击InfluxDB图标:
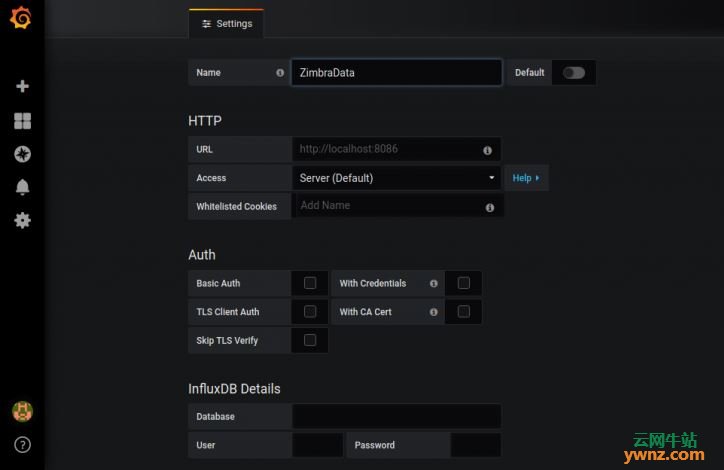
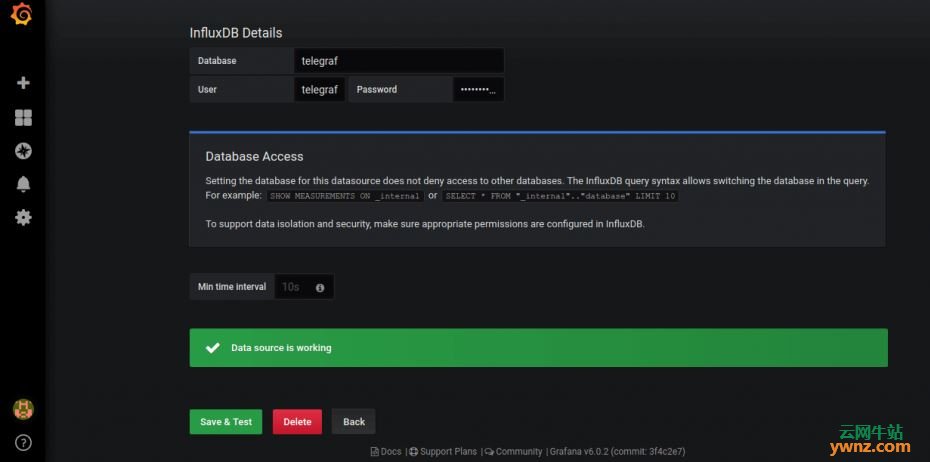
在上面的屏幕上,输入名称和InfluxDB的详细信息,输入telegraf.conf文件中指定的数据库,以及同一文件中的用户名和密码:
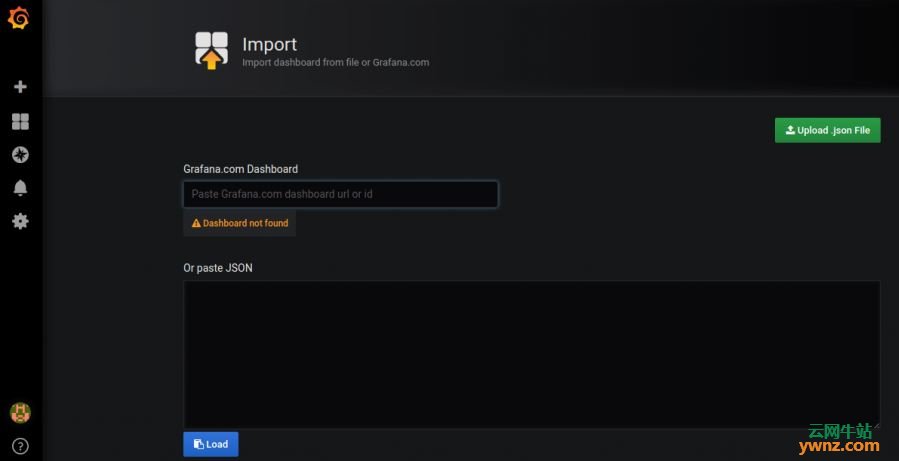
如上图所示,可以看到绿色的选项,完成后,我们可以导入仪表板,这个仪表板是由Jorge de la Cruz(jorgedelacruz.es)创建的,地址是:https://grafana.com/dashboards/2846,将2846作为仪表板ID并单击加载:
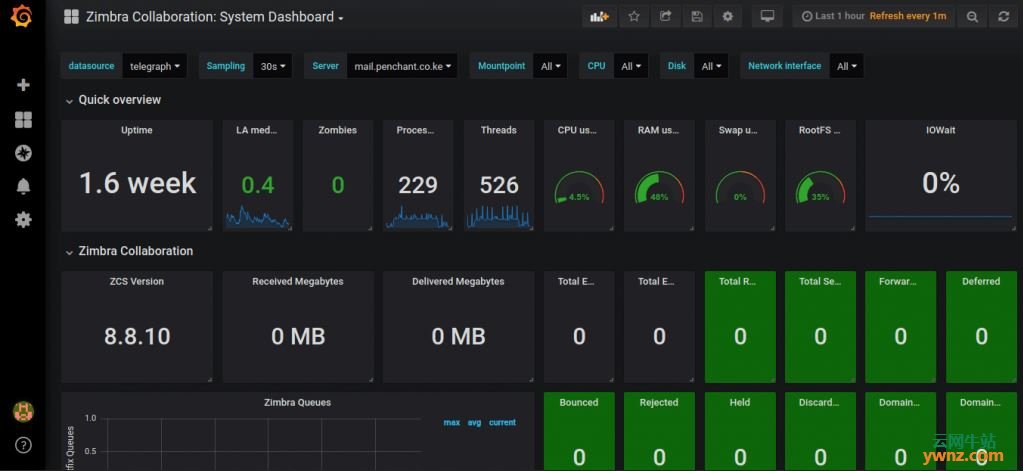
可以看到如下图的仪表板显示效果:
至此,配置完成。
相关主题 |